Data Engineering
From Spreadsheet Rounds to One Pricing Platform Covering 100% of the Portfolio
How RUBICON digitized price reviews on Azure and Databricks for an enterprise client, and made 14 million row dashboards 30x faster
Overview
100% of the portfolio priced: every customer and product, including items with no recent sales. Before, reviews covered only items sold in the past 24 months.
Up to 30x faster dashboards: filtering 13.9 million rows now takes 7 to 24 seconds instead of 3.7 minutes
7 years of pricing history: archived automatically every year, ready for audit
An enterprise client reviews thousands of customer and product prices every year as costs and markets move. Until recently, every review ran offline in spreadsheets, round after round. The client's own teams called the process time consuming, cumbersome and prone to error, and it left gaps for auditors.
RUBICON replaced it with one pricing platform on Azure and Databricks. Pricing managers, sales teams, admins and shared-services staff now work in a single workflow that tracks every change and approval and shows the profit impact before anyone submits a price. The platform takes its pricing logic from SAP, so every customer and product is priced the way SAP would price it, and the whole portfolio is covered, not just products that sold recently.
The decision: integrate with the source, don't duplicate it
Part of the platform's logic belongs to a system that another of the client's teams runs. The alternative was to duplicate that logic and maintain it ourselves. We integrated with the owning team's system instead, which removes the duplicate and reduces the checking business users do. By design, it cuts points of failure from 7 to 3: two components we own, and the upstream data itself.
Challenges
Business Challenges
Replace an offline, spreadsheet-driven review process with one digital system, without stopping the business
Price at several account and product levels, with discounts, surcharges, volume scales and minimum margins that differ by role and business unit
Review the entire portfolio, including products with no recent sales
Show management the financial impact of price changes against business targets
Harmonize pricing across business units while keeping each unit's specific rules
Make every pricing decision auditable
Serve new user groups as the company moved its sales processes to Salesforce, with roles that kept evolving after release
Technical Challenges
Stabilize an early low-code solution and move scattered Excel data into one central platform
Bring SAP's pricing logic, with its many condition types, into the platform so prices match SAP across every scenario
Filter 13.9 million rows of price guidance data fast enough for every user scope, with row-level security on every query
Export large data sets, such as a full year of pricing history, with each user's access rights applied
Move from the low-code prototype to a custom platform while users kept pricing
Solutions
Each phase started with a multi-day Lean Inception workshop with business and technical people in one room, and users tested every increment before go-live.
From low-code proof of concept to an enterprise platform. The proof of concept ran on Power Apps and Power BI. We stabilized it, moved its data to a central platform, then built the full platform on Microsoft Azure with a complete approval workflow and granular pricing levels.
Pricing logic from SAP. We brought SAP's pricing procedure, which picks the most relevant price from many condition types, into the platform. Every price follows the same rules as in SAP, which makes full-portfolio coverage and scenario planning possible.
Built on the client's data mesh. The platform consumes other teams' data products, transforms them in Databricks and serves them to pricing users, instead of maintaining its own copies.
Minimum margin. Discounts, surcharges, volume scales and minimum margins per role and business unit are enforced in the workflow.
Audit on autopilot. Annual archiving keeps 7 years of pricing history ready for auditors.
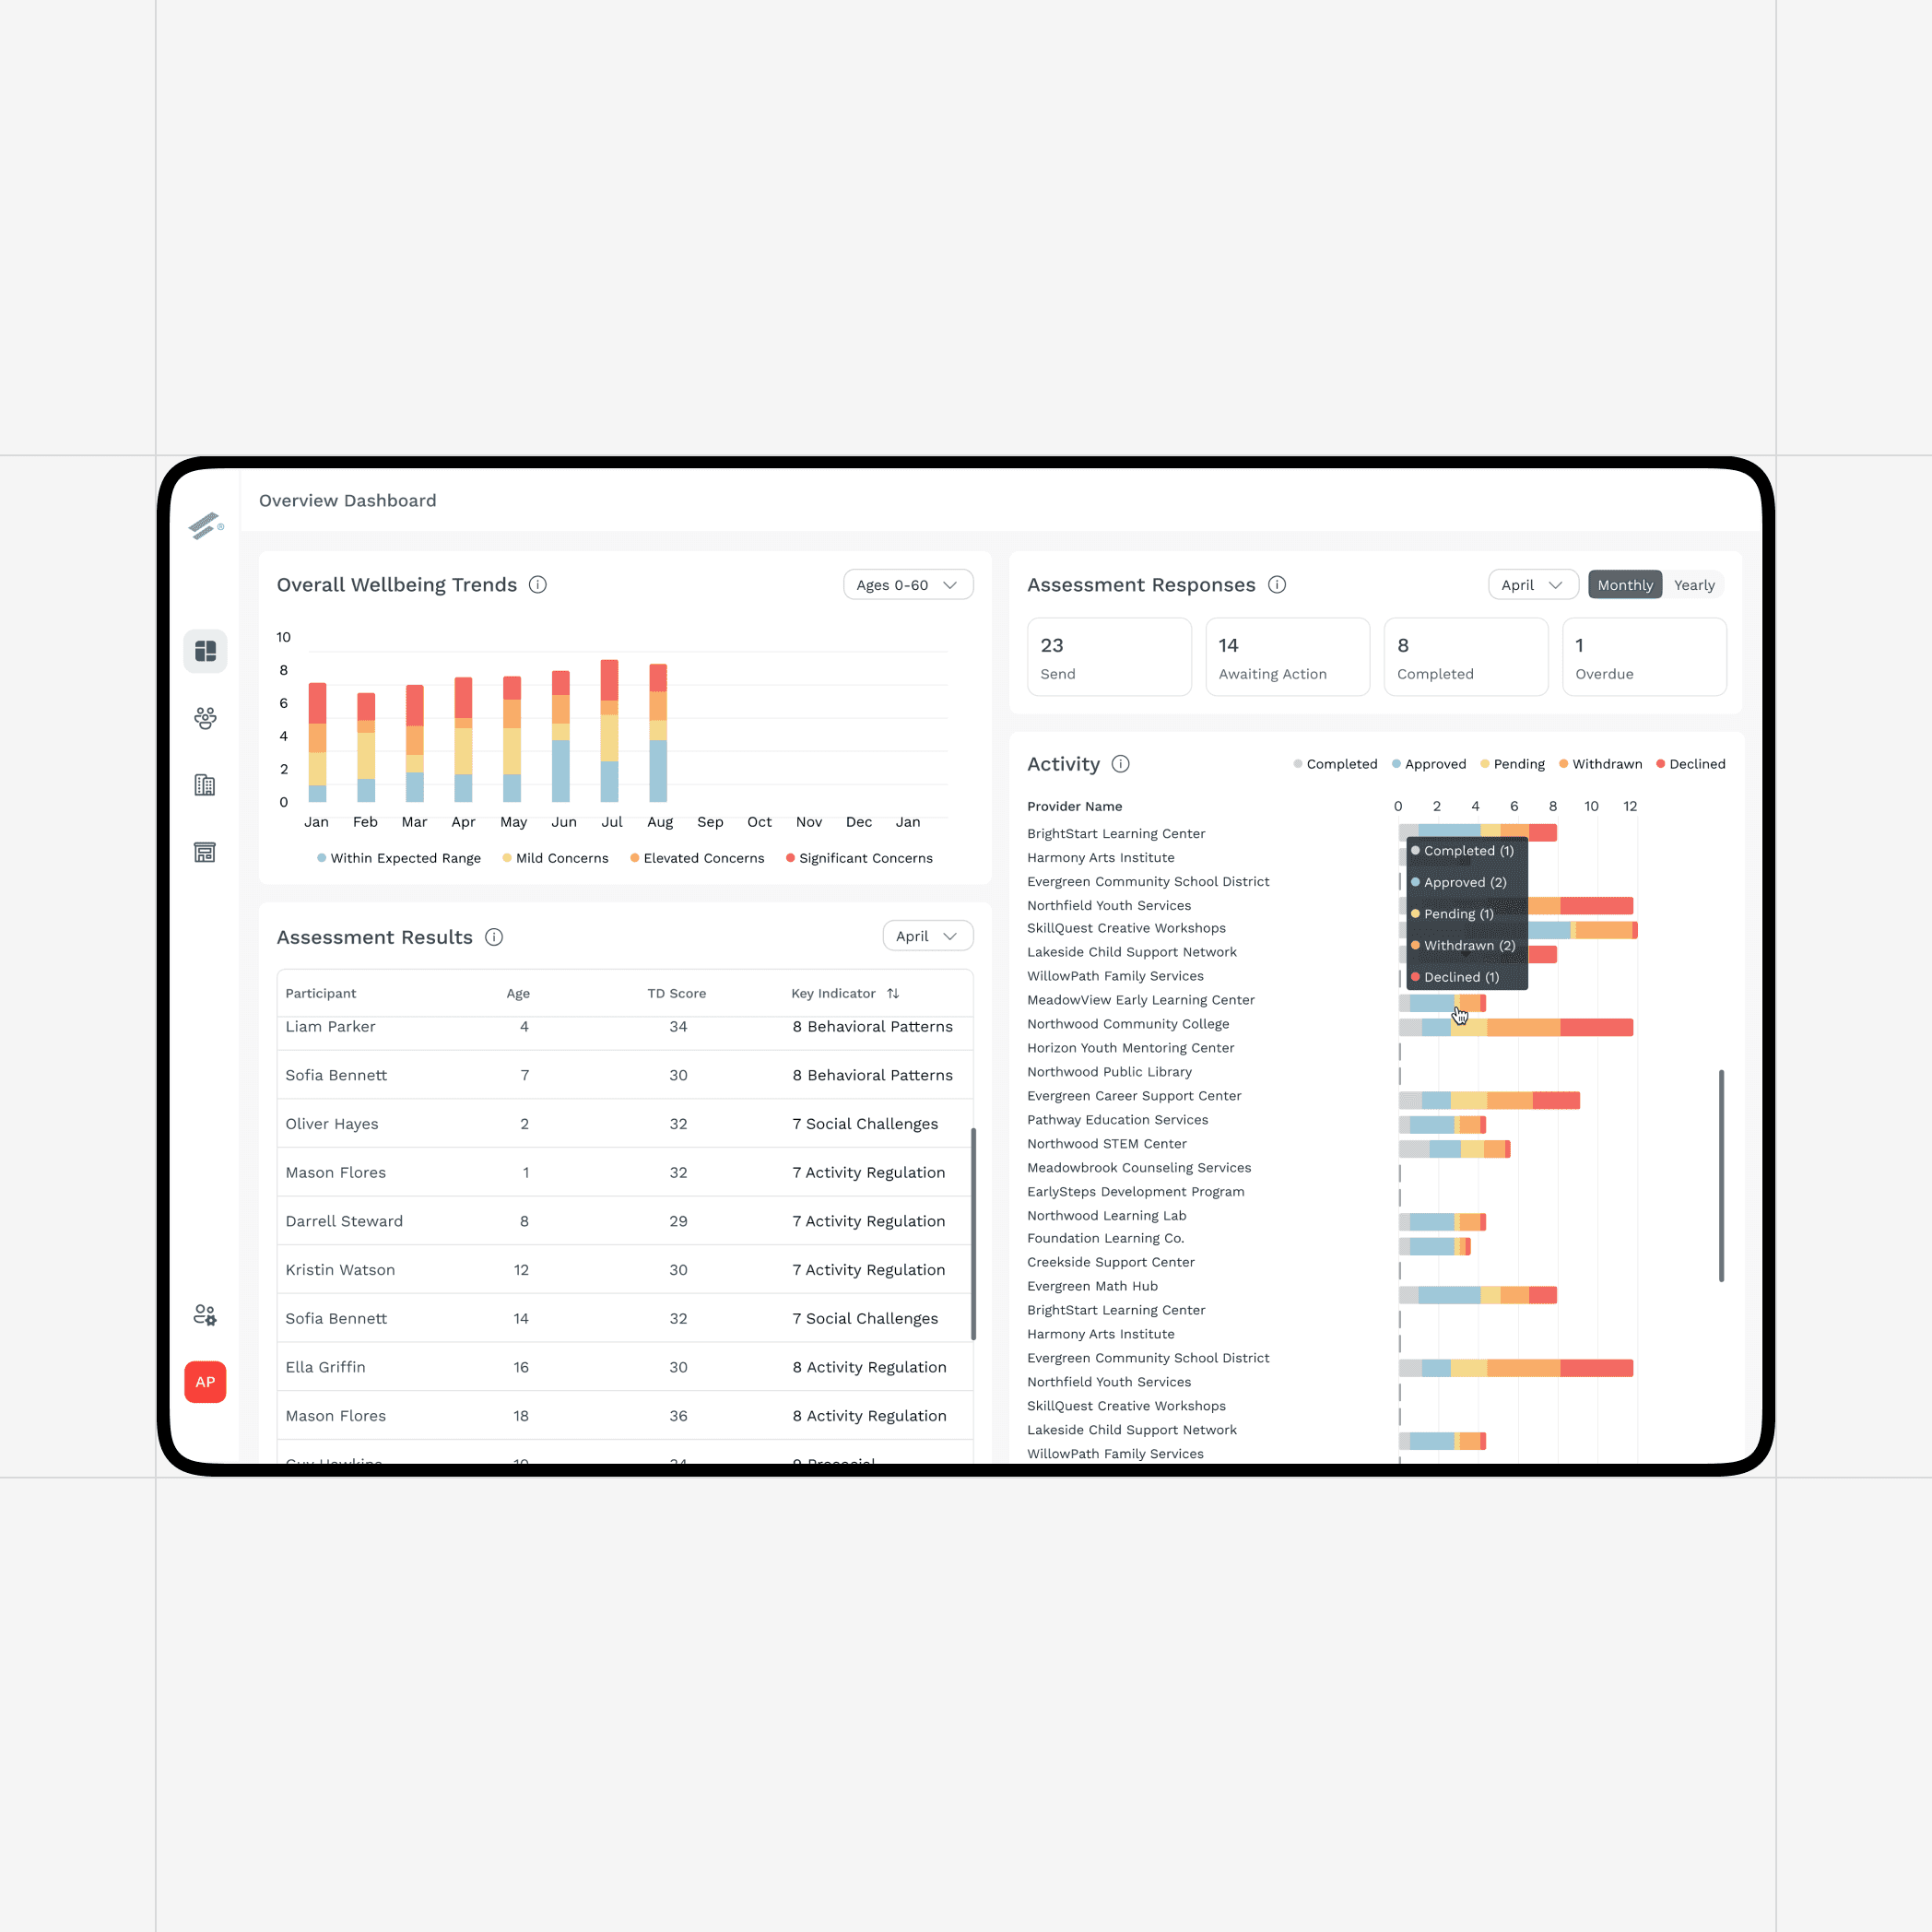
Real-time dashboards. Price and margin data, target price guidance and cross-business-unit consistency checks, with access mapped to Salesforce roles.
Each business unit sees only its own data. Row-level security is applied in the database before any dashboard asks for data, so one unit never sees another unit's prices.
Large exports that respect access rights. Exports run as background jobs that carry the user's identity from start to finish, so a full-year export contains only the rows that user may see.
Built for change. Feature flags switch behavior per role without a redeploy.
Results
One digital workflow replaced multiple offline spreadsheet rounds per price review. Before, every step ran manually in Excel.
100% portfolio coverage, including products with no sales history. Before, reviews covered only items with transactions in the past 24 months.
Audits without the scramble: archived exports are available on demand. Before, audit preparation was manual and its outcome uncertain.
One platform for every pricing role: pricing, sales, admin, shared services and product teams. Before, each role worked in its own tools.
Pricing rules consumed as a data product: the platform reads them from the owning team's data product in the client's data mesh instead of keeping its own copy. By design, that cuts points of failure from 7 to 3 once the connection is complete.
Up to 30x faster dashboards: filtering 13.9 million rows now takes 7 to 24 seconds instead of 3.7 minutes
Full-year archive export: about 68,000 rows in about one minute
Early adoption: application logs show business users working in the new dashboards from the first weeks
Lessons
What we would tell anyone moving a business-critical tool off Power Apps.
Low-code is a good way to prove an idea, and a poor place to scale it. The Power Apps and Power BI version got the pricing team working digitally within months. Its limits appeared as the scope grew: millions of rows, per-user data security and controlled releases. Next time we would plan the exit from low-code on day one.
Agree on what the business is reviewing before engineering the data. Our hardest rework came from one question: what exactly is one price under review? What sold in the last two years and what has a valid price today are both correct answers, and they give different lists. A definition agreed before the first table is designed would have saved several iterations.
Recreating a core system's logic is a project of its own. We agreed up front what the platform is not: not real time, not a full copy of SAP, no rule editing. Gaps still showed up only when users compared results with SAP in production. We would start that testing with business users from the first release.
In a data mesh, other teams' data products set your critical path. Every upstream change becomes your change too. Most of our fixes around the Salesforce dashboard go-live came from source data mappings, not from our own code. Data contracts and joint test plans with each data owner matter as much as the pipelines.
Security that follows every user has to be designed for speed. Row-level security runs on every row, and for users with narrow access it made the largest dashboards slow. We narrowed the data before the security check runs, and switched only once benchmarks showed identical results for every role.
Scope
A low-code proof of concept, then a custom platform delivered in five phases. Phase 5 is in progress, and its latest dashboards went live in September 2026.
Looking ahead
The current phase finishes the connection to the upstream pricing rules and moves transactional data in at a finer level of detail. Next, the business and technical teams will define a new pricing procedure for prices below the customer level.
Moving a pricing or planning process off spreadsheets? See how we approach data engineering and analytics and BI on Azure and Databricks.
Technology stack
Data: Azure Databricks (PySpark, Delta tables, serverless jobs), Python
Database: Azure SQL with stored procedures, row-level security and partitioned staging tables
Backend: .NET 10, Azure Functions and Durable Functions
Frontend: Angular 20, TypeScript, AG Grid Enterprise
Enterprise systems: SAP, Salesforce
Identity and security: Microsoft Entra ID, Azure Key Vault
Infrastructure: Terraform, Docker, Azure Container Registry, Azure Web App for Containers
DevOps and quality: Azure DevOps YAML pipelines, SonarQube, Application Insights
Early prototype: Power Apps, Power BI