
SHORT ANSWER
A knowledge graph stores information as entities, such as customers, products, suppliers or documents, and the relationships between them, along with what each type means. It lets people and AI systems answer connected questions, like which products depend on a delayed supplier, that are hard to answer from separate tables or text. A focused first graph typically takes two to four months.
A knowledge graph represents knowledge as a network of nodes and edges. Nodes are entities such as a customer, product, contract or regulation. Edges are relationships such as supplies, contains or is governed by. Both can carry properties. An ontology, or schema, defines what each type and relationship means, so people and software read the data the same way.
How does a knowledge graph work?
Modelling: domain experts and engineers define entity types and relationships, often starting from a workshop such as Event Storming.
Mapping sources: you map data from ERP, CRM, product and document systems to the model and merge duplicates into single entities.
Extraction: LLMs or NLP pipelines pull entities and relationships out of unstructured documents.
Storage and query: a graph database such as Neo4j holds the graph, and you query it with Cypher, GQL or SPARQL.
Use: applications, analytics and AI assistants walk the graph to answer connected questions.
Why does it matter for enterprises?
Your company’s knowledge sits in systems that each hold part of the picture. A question like “which customers are affected if this plant stops?” means joining many tables and documents. A knowledge graph makes those links explicit. For AI, it adds a grounding layer that makes answers more accurate and easier to explain. That’s why it sits at the core of GraphRAG, an extension of retrieval-augmented generation.
Relational tables vs. knowledge graph
| Relational database | Knowledge graph |
|---|---|---|
Data model | Tables, rows, foreign keys | Nodes, relationships, properties |
Multi-hop questions | Many complex joins | Natural traversal |
Schema changes | Migrations needed | Flexible, add new types |
Meaning of data | In documentation | Encoded in ontology |
Best for | Transactions, reporting | Connected data, AI grounding |
Where should you start?
You don’t need to model the whole company. Start from a short list of questions users can’t answer today, model only the entities and relationships those questions need, and extend the graph as new use cases appear. Automated pipelines that keep the graph in sync with source systems matter more than the size of the first model.
Be careful with fully automatic graph builders. On an enterprise GraphRAG chatbot, we piloted an LLM tool that generated the graph from documents. It invented roles that didn’t exist and created duplicate nodes for the same person. We switched to a hand-built layer of verified people, roles, projects and departments, and attached documents to it. The graph stayed free of duplicates. The trade-off is that someone has to add each new project lead by hand before the system knows about them.
How RUBICON helps with knowledge graphs
We build knowledge graphs on Neo4j that let people ask plain-language questions across connected company data and see the query behind each answer. See our AI and machine learning services, or our architects can work through your questions with you.
Related terms
Frequently asked questions
What is the difference between a knowledge graph and a graph database?
A graph database, such as Neo4j or Amazon Neptune, is the storage technology. A knowledge graph is the content and the model: the entities, relationships and definitions that describe a domain. You usually store a knowledge graph in a graph database, but you can also build one on RDF triple stores or even relational tables.
What is an example of a knowledge graph?
Google's Knowledge Graph, launched in 2012, connects facts about people, places and organisations to improve search results. In a company, a knowledge graph might link products, components, suppliers, plants, regulations and documents. A user can then ask which products contain a restricted substance and which customers bought them.
How do knowledge graphs help large language models?
They give LLMs verified facts and relationships to work with. In GraphRAG, the system retrieves relevant parts of the graph along with text, which helps with questions that span many documents or need several reasoning steps. Graphs also make answers easier to explain, because you can show the path the system took through the data.
How long does it take to build a knowledge graph?
As a typical range, a focused graph for one use case, with a handful of entity types and a few source systems, takes two to four months to reach production. Company-wide graphs grow over years. Most of the effort goes into agreeing the model, matching entities across systems and keeping the graph up to date.
Related case study
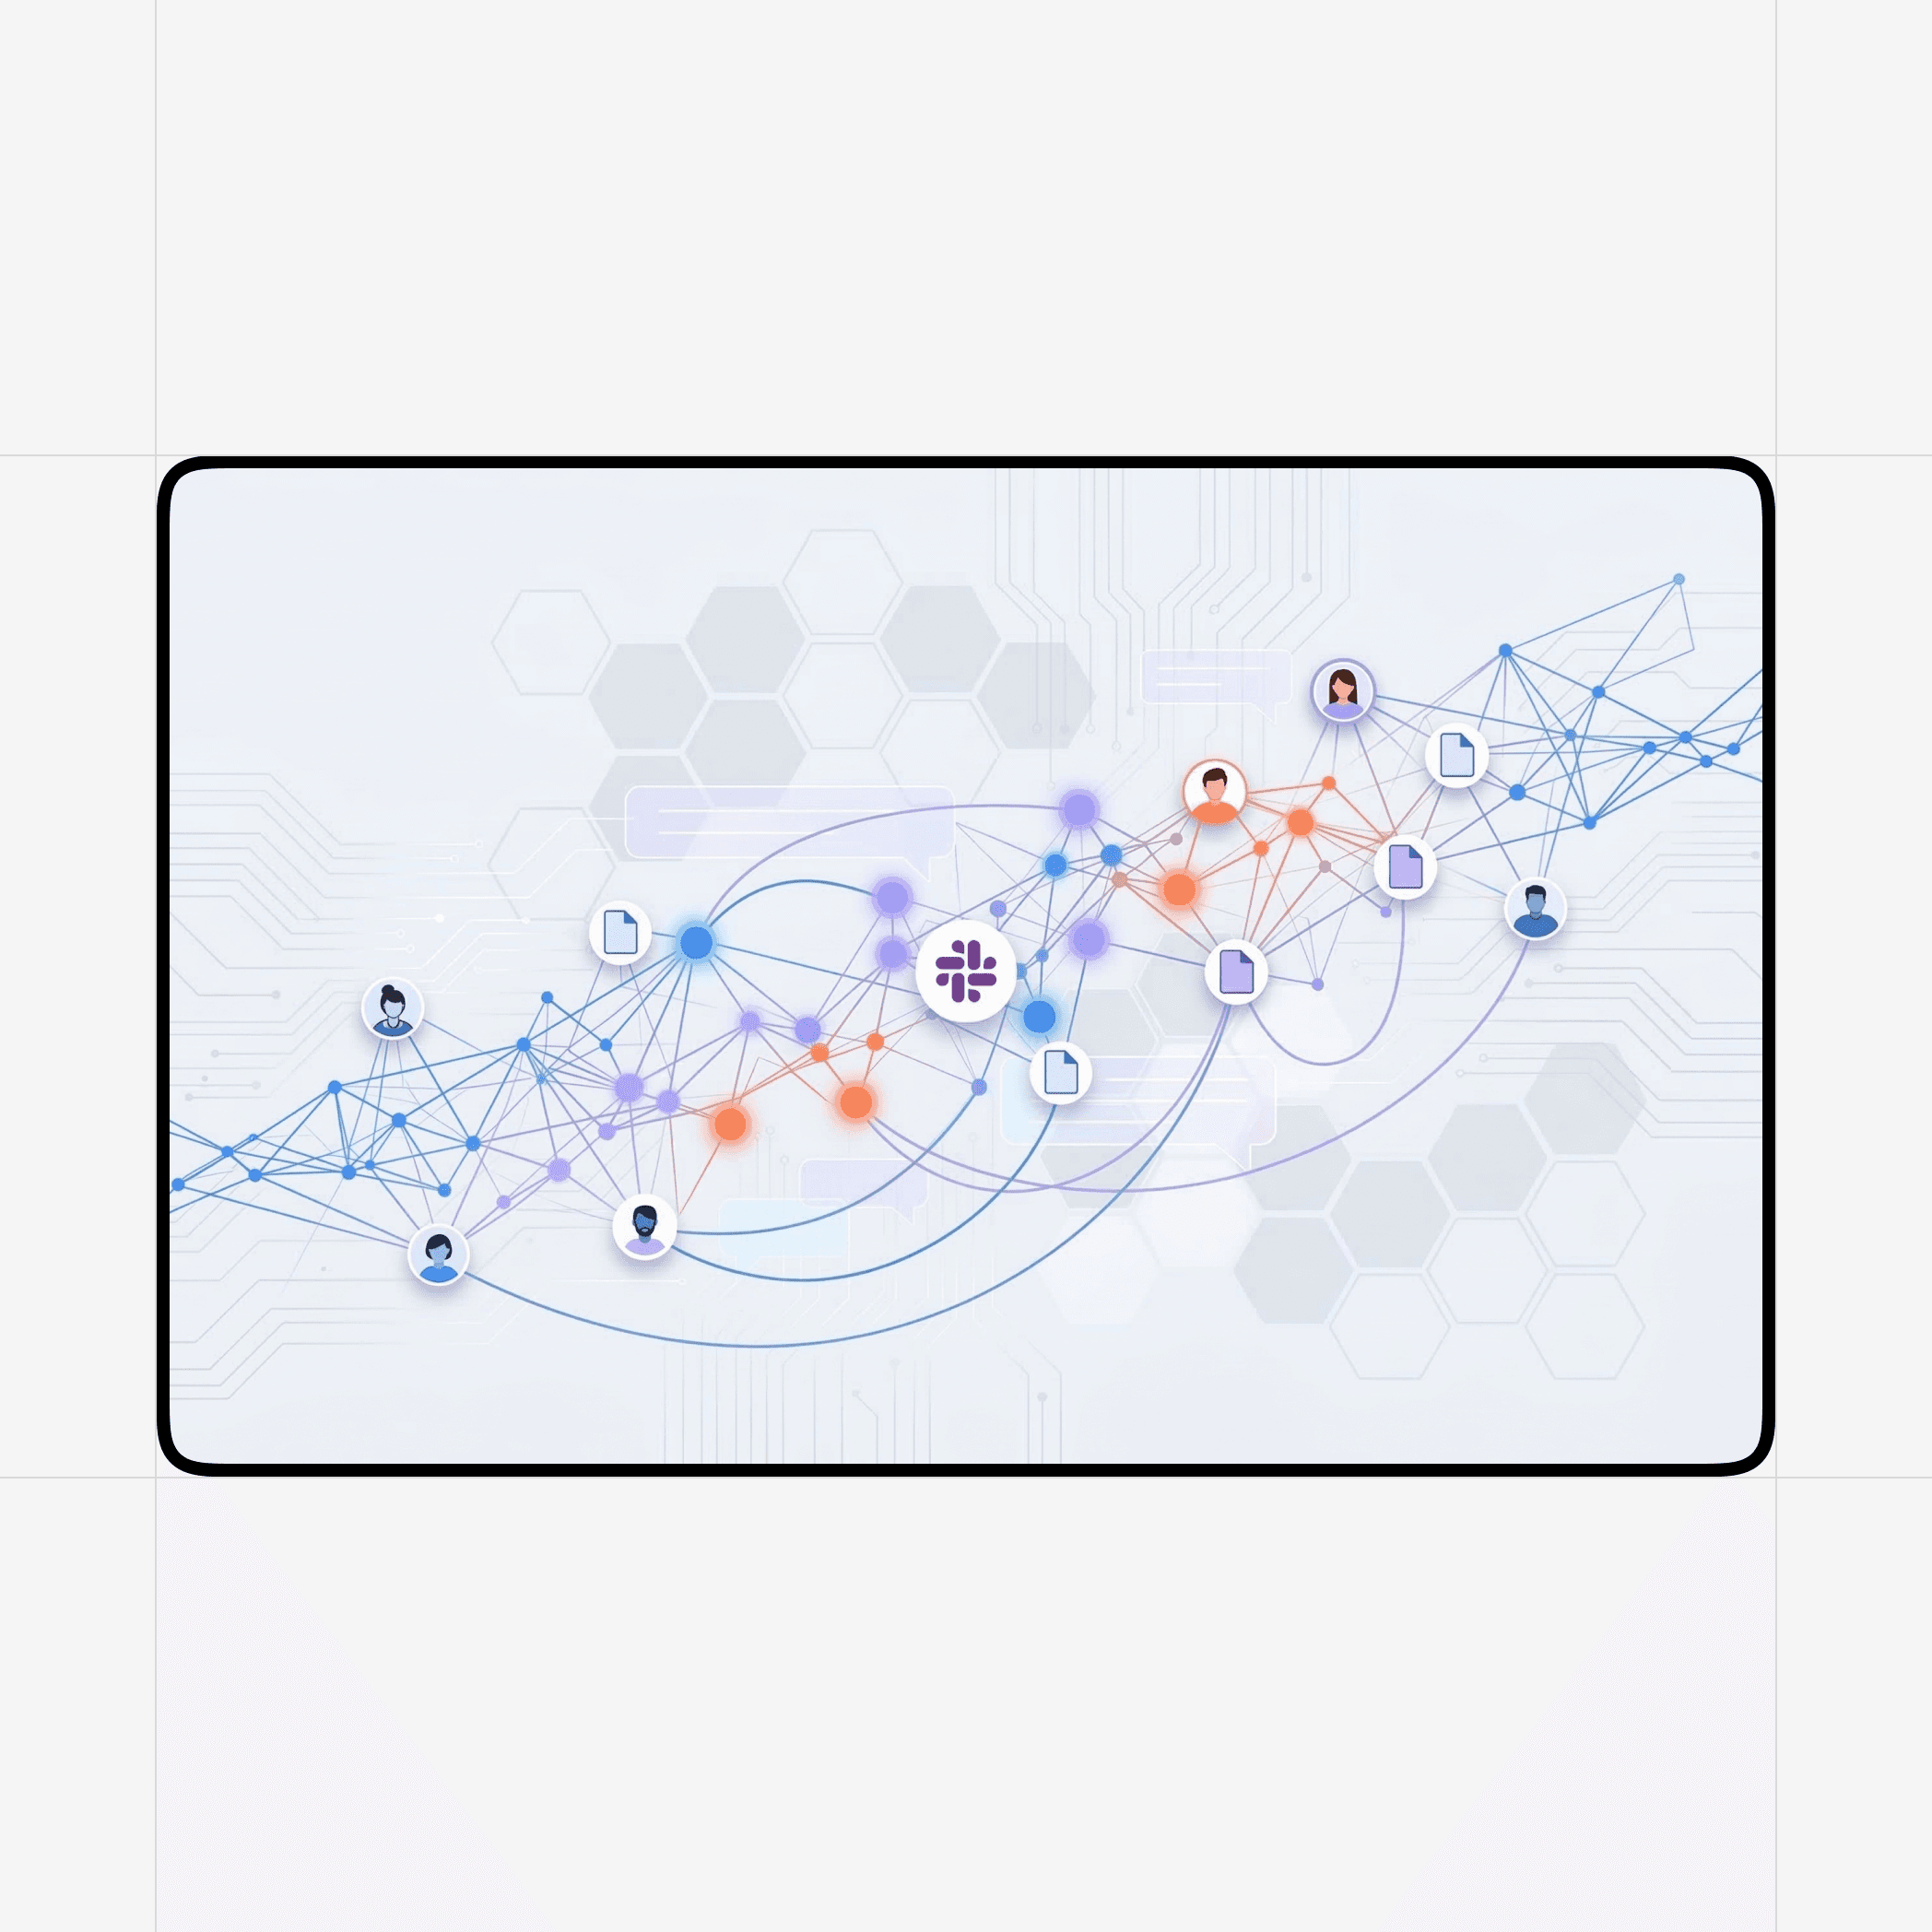
Enterprise GraphRAG Chatbot with Neo4j | Case Study
How RUBICON's Two Layer Fixed Entity Architecture eliminated data bottlenecks for a multi team enterprise, delivering a conversational AI system that gives leadership instant project clarity, without hallucinations.
More resources