" height="48.00000014038086px" id="xQ5vVHKqO" width="172.73399414062501px"/></svg>)
Data Analytics
Supply Chain Insights through Digital Twin Analytics
RUBICON Develops a Custom Digital Twin Supply Chain Management Platform for a Global Client

Client quote
"The digital twin platform helps me overlook operations globally. It provides agility and I can quickly reply to questions related to material flow when necessary. It speeds up the whole improvement process and finding quality issues."
Global Supply Network Steering Manager)
Overview
In the era of Industry 4.0, where digitalization and real-time analytics are key, the concept of a digital twin is revolutionizing modern manufacturing. A digital twin, a virtual replica of physical assets, systems, or processes, is becoming an essential tool for businesses looking to optimize their operations.
After successfully delivering a custom SCM data platform, RUBICON continued the partnership with the Chemical & Consumer Goods client and went on to deliver a Supply Chain Digital Twin Platform. The client, a global leader in the industry with a rich history spanning over 100 years, sought to replace their existing costly platform that faced performance and usability issues whilst rendering a large number of nodes in the graph.
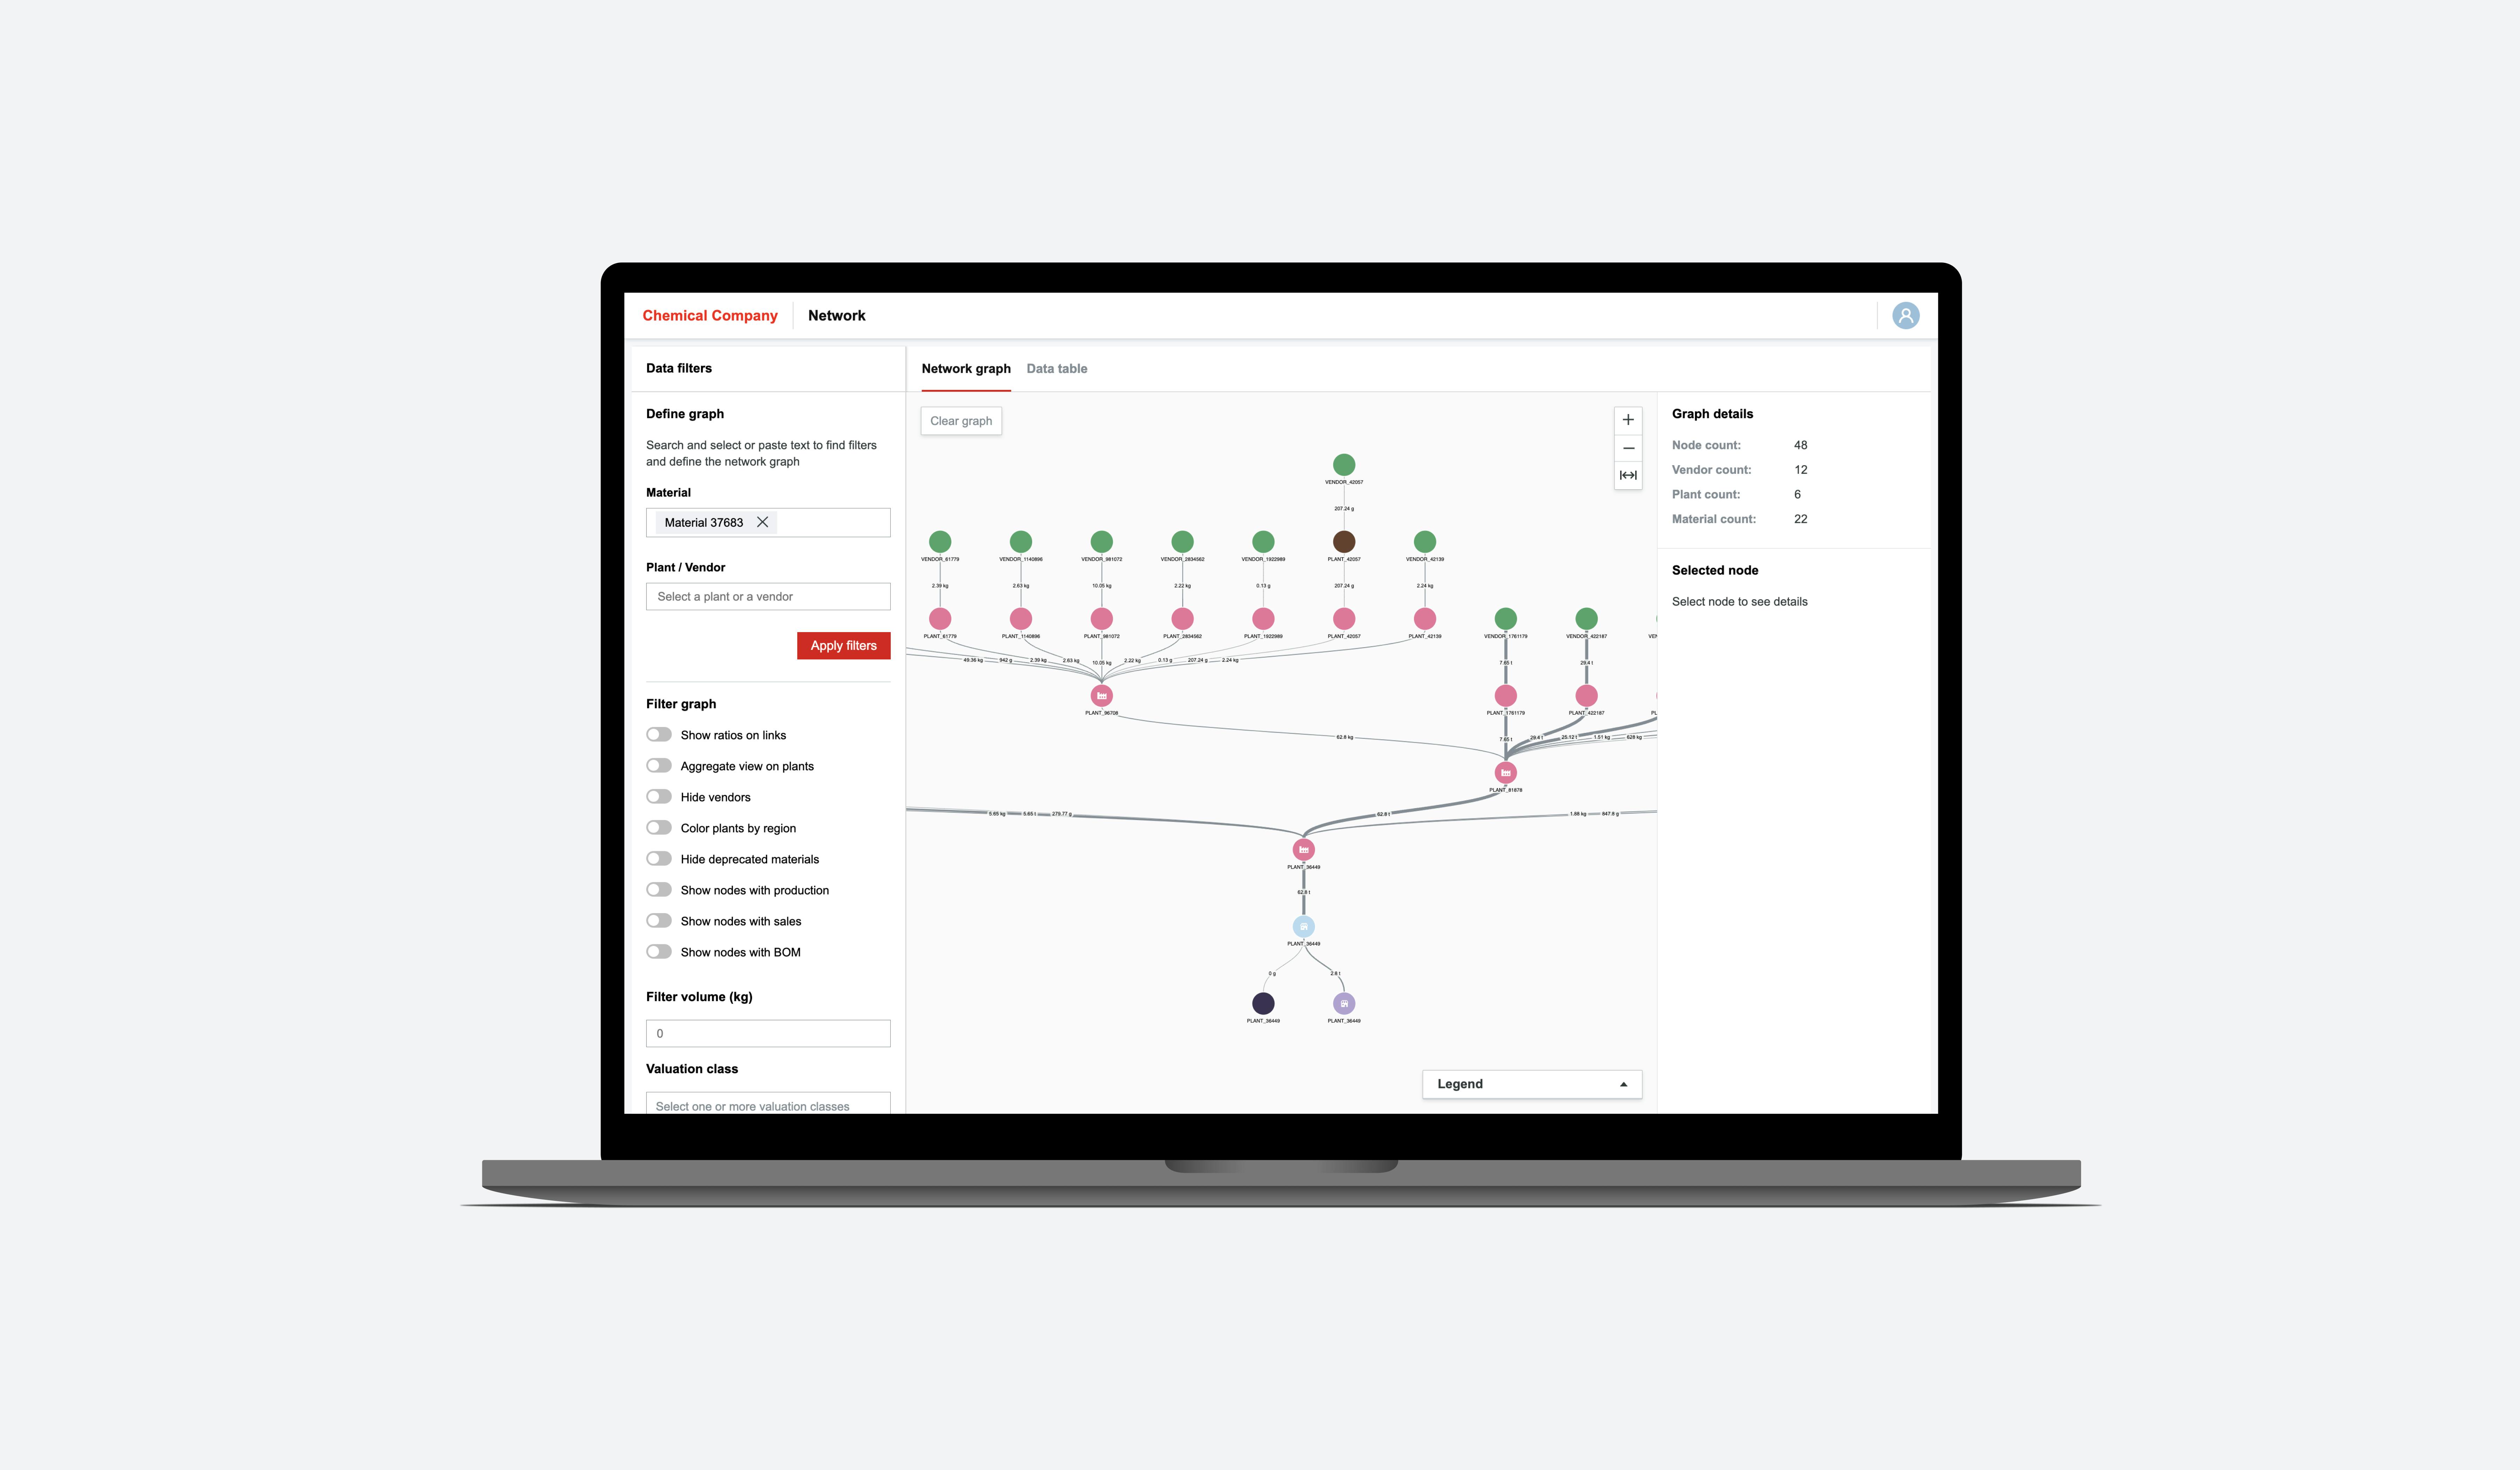
The new platform aimed to enable users to better understand and manage their supply chain data, by applying graph analytics and supply chain visualization of a graph. This platform enables users to query and analyze material and product flow in the supply chain. After rendering, the user can traverse through the graph, apply additional filters, and, for example, see where the material is used in the product line. The aim was to deliver a less costly and more efficient platform than the already existing off-the-shelf platform. Having thousands of different products and large datasets makes it hard to remember them all and spot when something is wrong. With the graph that allows for easy visualization of that data, we accelerated the improvement processes and found quality issues. Our product was successfully delivered in the designated timeframe.
Challenges
While developing the Supply Chain Digital Twin solution, our team overcame the following challenges:
Replacing off-the-shelf solution that has performance and usability issues with less costly, customizable, full ownership solution
Allowing the user to overlook the entire material flow globally
Visualizing the supply chain data in Sequential graph layout. The sequential layout is designed to display data in situations where information flows from one level to another, such as material and product flow in the supply chain
Enabling user-friendly and performant UI visualization of the supply chain as a graph, by making sense of the connected data in the graph
Ensuring filtering of supply chain data in multiple dimensions, like plant and/or material data
Enabling navigation and traversal through the graph, by expanding and collapsing nodes
Implement graph visualization based on the D3.js's tree layout, that is using the Reingold–Tilford “tidy” algorithm
Defining and implementing graph data models and data architecture for the application. The company provided multiple data sources, from their internal systems, that are in a flat relational format
Choosing the best-fit DB engine for querying and storing supply chain data that satisfies application business requirements, and enables sequential graph layout visualization, filtering data, aggregating data, traversing, and calculating
Designing and implementing data ETL (Extract Transform Load) pipelines to extract data from provided sources, transform the data into a graph data model, and load that data into the systems Neo4j Graph DB
Solutions
RUBICON’s solution to the client’s problem entailed a custom-made Supply Chain Digital Twin platform that enables supply chain visualization using sequential graph layout and enables graph analytics. The solution included building a full-stack cloud-native platform on Azure, using a Graph database, data pipelines, and implementing an SPA application that enables graph visualization of the data. A custom-made platform is designed to be more efficient, easy to use, and less costly compared to the already existing off-the-shelf one.
The software development process started with a Lean Inception workshop, to define the project scope, focusing on understanding the business domain, supply chain material flow, and data. When we agreed on the project scope, our developers started developing a Proof of Concept for core use cases of the application, in order to test multiple Graph DB engine choices. Another Proof of Concept was developed for Sequential Layout Graph Visualization of the material flow. After successfully completing the POCs, the project development commenced. Consistent collaboration and communication with stakeholders, along with a shared understanding of complex supply chain data flows, ensured the project's success.
Results
Due to exceptional knowledge and consistent collaboration, our team delivered the final product in five months.
They managed to:
Create a Digital Twin platform, a custom full-stack cloud solution for graph analytics, filtering, traversing, and visualizing the supply chain data
Implement a custom application that visualizes supply chain data in Sequential graph layout, using D3.js JavaScript library
Make the software that enables graph analytics filtering the supply chain data in multiple dimensions, as well as the navigation and traversal through the graph
Utilize the Neo4j Graph database engine, intended for querying and storing big supply chain datasets
Implement data ETL pipelines, that transform and load the data into the system on a daily basis
Achieve significant cost savings by replacing the existing off-the-shelf platform with a custom Digital Twin platform, allowing for more precise control over the supply chain data and reducing unnecessary expenses
Technology stack
C#, ASP.Net Core, Neo4j, Azure Data Factory, Azure Active Directory, Azure Application Insights, Azure App Service, Azure Storage Account, Azure Virtual Machine, D3.js, Angular, Azure DevOps, Docker, Iaac with Terraform- Terragrunt
Backend Technologies
C#, ASP.Net Core
- Implementing the backend APINeo4j
- Storing and modeling the supply chain data
- Querying the supply chainAzure Data Factory
- Automating ETL data processing of supply chain data
Azure Technologies
Azure Active Directory
- Implementing single sign-on authenticationAzure Application Insights
- Monitoring the applicationAzure App Service
- Hosting the backend APIAzure Storage Account
- Storing datasets for graph database and hosting the frontend single page applicationAzure Virtual Machine
- Hosting the Neo4j database
Frontend Technologies
D3.js
- Implements tree layout, that is using the Reingold–Tilford “tidy” algorithm for layout and node position calculation
- Implements Sequential graph layout
- Navigation, traversal, and interaction with graph nodesAngular
- SPA implementation
DevOps
Azure DevOps
- Used for all-out collaboration with source control, work tracking, and continuous integration and deliveryDocker
- Packaged our solution for easy and quick deploymentIaac with Terraform- Terragrunt
- To provision and configure our environments we used a combination of terraform and terragrunt


" height="48.00000014038086px" id="y_gzzqZQT" width="172.73500122070314px"/></svg>)
